Metropolitan Transport Information System
by Digital Geographic Research Corporation
25+ years innovating
- HOME
- PRODUCTS & SERVICES
- RESOURCES
News & Commentary News & Press Reports Light Technical Geography 80-20 (nuggets for adults) Geography Kids' Hangout Technical METRIS Publications GIS Publications Associated projects NCRST VITAL
- ABOUT
The 2011 Turn Time Study: Consensus in LA/LB
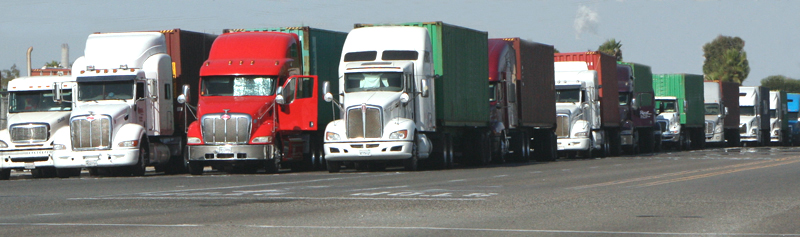
When trucks idle outside and inside marine terminals, it's at tremendous cost. Goods worth tens of millions languish on the piers, and profits leak from truck drivers and motor carriers, terminal operators, BCOs and ports. Neighboring communities suffer air quality and health problems. What's at the root of such costly delays: raw infrastructure or operational capacity limits, poor management decisions, or broader policies such as fees? What needs to change? Is an appointment system effective? What impact is a construction project having on traffic circulation?
These are the macro questions a turnaround time study ultimately addresses. A first step is to acquire spot-on accurate metrics of the truck-terminal experience, and to understand the patterns of port congestion, reliability and capacity.
General Observations on Turn Time
TURN TIME RESOURCES
Long truck turn times have numerous causes: some related to physical capacity (land, equipment), some operational (poor information flows, competing pressures of vessel and train schedules, uneven and unpredictable demand for service). Some delays are due to political conflicts, or unintended consequences of policies.
The purpose of turn time research is to explore multiple dimensions of a port's performance, to identify the when and where of productivity, and to highlight the dominant systemic factors that impede efficiency, that can realistically be remedied.
There are a few important problems with traditional turn time debates:
- They can be combative. The goal is often to settle an argument over how long waits really are, and who's to blame.
- The statistics are not easy to interpret. Pardon the jargon, but most statistics we use in conversation apply to “normal” distributions. Turn time has a heavily skewed distribution, which does not follow the same rules. An average reflects nothing that's meaningful to any party. The irritant in turn time is not the average. The average is also useless for logistics planning. What matters is reliability and capacity.
- Objective data are difficult to obtain. Terminals clock the in-gate and out-gate, not the entry queue. Truckers' accounts are anecdotal, and they're inclined to dwell on the longest episodes.
- GPS measurements are subject to multiple sources of error, about which few analysts are knowledgeable. Alternate technologies are expensive.
The solution to the turn time challenge is partly institutional, partly technical. First, the right parties need to participate, on the right terms. Second, it takes a special class of accurate, objective measurements, and thoughtful analysis, to steer the dialog in constructive directions. In the following sections we describe the 2011 METRIS Turn Time Study in southern California, as a case study, and reflect on the takeaways.
The 2011 METRIS Turn Time Study
In summer 2010, in the ports of Los Angeles and Long Beach, a Truck Turntime Stakeholders Group (TTSG) was constituted, comprising LMCs, MTOs, BCOs and the two ports. TTSG was co-chaired by the late Josh Owen of Ability/Tri-Modal (an LMC, on behalf of the California Trucking Association) and Bruce Wargo of PierPass (an association of MTOs). Than Seeds of steamship line APL joined the two co-chairs on a small task force to organize a study. In January 2011 they hired Digital Geographic (DGRC) to investigate turn time, based on our METRIS fleet of about 250 instrumented port trucks from a dozen LMCs. Costs were borne in equal parts by Tri-Modal, PierPass and the ports. PierPass formally fronted the contract.
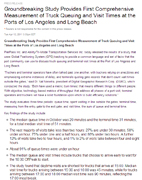
In March 2011 we presented initial findings to TTSG. To the surprise of many, the report was not an indictment of any party. It was a constructive and illuminating look at a variety of KPIs, reliability and capacity, causes of congestion, and recommendations for remedial action. The general membership of TTSG arrived at immediate consensus approving the report and its recommendations. The Waterfront Coalition promoted it. PierPass produced a film clip, and issued a press release on the “groundbreaking study,” that attracted international coverage.
 Executive Summary |
 Press Release |
Film clip |
The principal findings:
- Port throughput was being seriously interrupted by labor breaks.
- There was plentiful physical and operating capacity when terminals were fully staffed.
- A Traffic Mitigation Fee, that applies to daytime moves, caused an artificial 6 pm surge of traffic avoiding the fee.
- The fastest terminals were 2 to 3 times faster than the slowest, and delays were concentrated at a few terminals. Those terminals were not identified, publicly or even privately, but we recommended a follow-up process to establish performance standards and to monitor compliance, which would end anonymity.
We did mention averages in passing. Inevitably they received disproportionate attention.
The period of the TTSG dialog was the only time in the past six years during which the indicators of productivity showed a significant and sustained improvement. There are many factors that affect performance, and this is not definitive evidence that TTSG was on the right track. But it is remarkable and noteworthy, and difficult to avoid that conclusion.
Takeaways and Technical Issues
One remarkable takeaway was that 250 GPS devices could generate findings on major port policy issues: labor hours, fees, capacity. Some findings were obvious from mountainous peaks in graphs; others emerged from relative dimples. It required accurate data and methods to pick up these nuances. Accuracy is critical for any type of comparative analysis: rating terminals, trends over time, impact of policies or events.
METRIS is purpose-built to deliver this accuracy. Two unique features set it apart: the ping rate, and analytical methods.
First, standard truck GPS devices ping at intervals of 2–15 minutes. METRIS was designed for metropolitan application; our high-quality spec calls for a ping every few seconds. On METRIS hardware we achieve this at the same cost as on 15-minute trackers, using proprietary techniques. Some argue that even 15-minute pings are fine, because debates on turn time are about 15-minute windows, not seconds. It is easily shown that this line of reasoning is severely flawed in the case of GPS data. Errors can range from seconds to hours.
Second, analysis of the data is difficult and error-prone. In-bound and out-bound lanes at some terminals are separated by just a chain-link fence, and GPS can't reliably tell them apart based on satellites orbiting 12,000 miles away. The off-the-shelf point-in-polygon algorithm, inherent in what's popularly known as geofencing, is simplistic and inappropriate to this task. In a 2011 NCFRP study of U.S. ports, the investigators recognized this potential for gross error, and performed their GPS analyses manually. Very few consultants are aware of error and how to manage it (see our article: Turn Time Measurement: Technical Hazards).
DGRC has specialized expertise in a couple of relevant areas: (a) We design our own GPS trackers. We know the sources, types and magnitude of error intimately. (b) We are specialists in geographic data modeling, and error diagnosis and remediation. So we created custom GIS data models of queue zones and terminals, and sophisticated algorithms, with multiple integrity tests that detect and correct/discard errors.
These techniques are the foundation of LiveQ, our unique real-time GPS-based queue monitoring service. LiveQ reports a measurement the moment a truck joins the back of a queue; it doesn't have to wait until the truck enters the terminal. By steering carriers away from the longest queues, as they're growing, LiveQ goes beyond documenting queues. It reduces the longest waits.
Every turn time measurement is a commentary on the performance of a commercial entity, and an element in the study of a major national freight asset. We have a responsibility to get it right. Accurate measurements produce convincing findings, point to constructive solutions, and inspire confidence in the multi-party process, transforming combative exchanges into consensus.
TURN TIME RESOURCES