Metropolitan Transport Information System
by Digital Geographic Research Corporation
35+ years innovating
- HOME
- PRODUCTS & SERVICES
- RESOURCES
News & Commentary News & Press Reports Light Technical Geography 80-20 (nuggets for adults) Geography Kids' Hangout Technical METRIS Publications GIS Publications Associated projects NCRST VITAL
- ABOUT
Transportation Planning
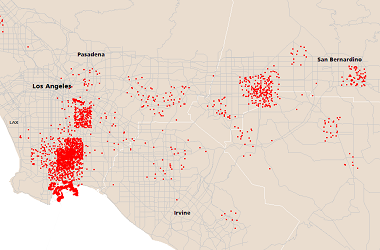
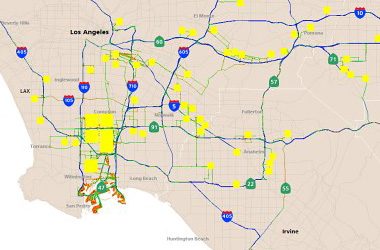
Planning multi-billion freight infrastructure demands goods movement models based on current, accurate data. METRIS produces data in real time. It measures flows, speeds, origins, destinations, routes, and congestion at ports, intermodal yards and highways. It follows trends by the week, or by the hour. When trade is slow due to the Chinese New Year, we know it. When flooding snares traffic on I-710, we know it.
Real-time data are fed to participating motor carriers. Here are samples of other analyses, of interest to planners. For business confidentiality and security, data are presented here with minimal detail, or are masked or distorted.
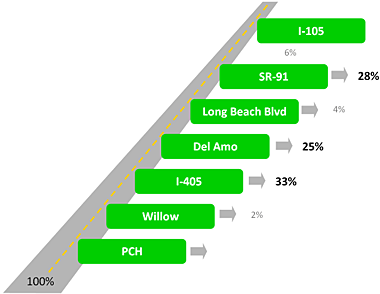
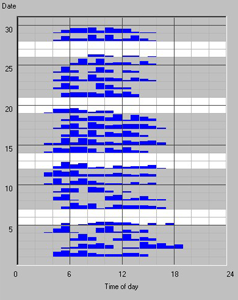
1—Basic Analyses
 |
 |
 |
 |
2—Modeling
 |
| Bobtailing is inefficient |
Beyond mapping and analysis, we model the freight system, identifying inefficient practices, and modeling alternatives. For example, consider deadhead travel (bobtailing, left) and the repositioning of chassis and empty containers. They represent 60% of all trips. In the Los Angeles basin, transport of empty marine containers accounts for 10,000 trips daily, or 250,000 miles of travel. With a small set of empty storage yards (ESYs) optimally located in the Los Angeles basin, we estimate savings of 46,000 miles of truck travel, 51 tons of CO2 emissions, and 4,500 fewer entries into the ports—reducing terminal congestion. Each day.
The empty container model was developed by Rick Church at UC Santa Barbara.